How to implement observability and monitoring for Google ADK agents (AgentOps, Arize, Phoenix, Cloud Trace)?
#google-adk#observability#monitoring#tracing#agentops#cloud-trace
Answer
Observability & Monitoring for Google ADK Agents
Monitoring AI agents in production is critical. Google ADK integrates with 8+ observability platforms for tracing, debugging, and performance monitoring.
Observability Options
1. Built-in ADK Tracing
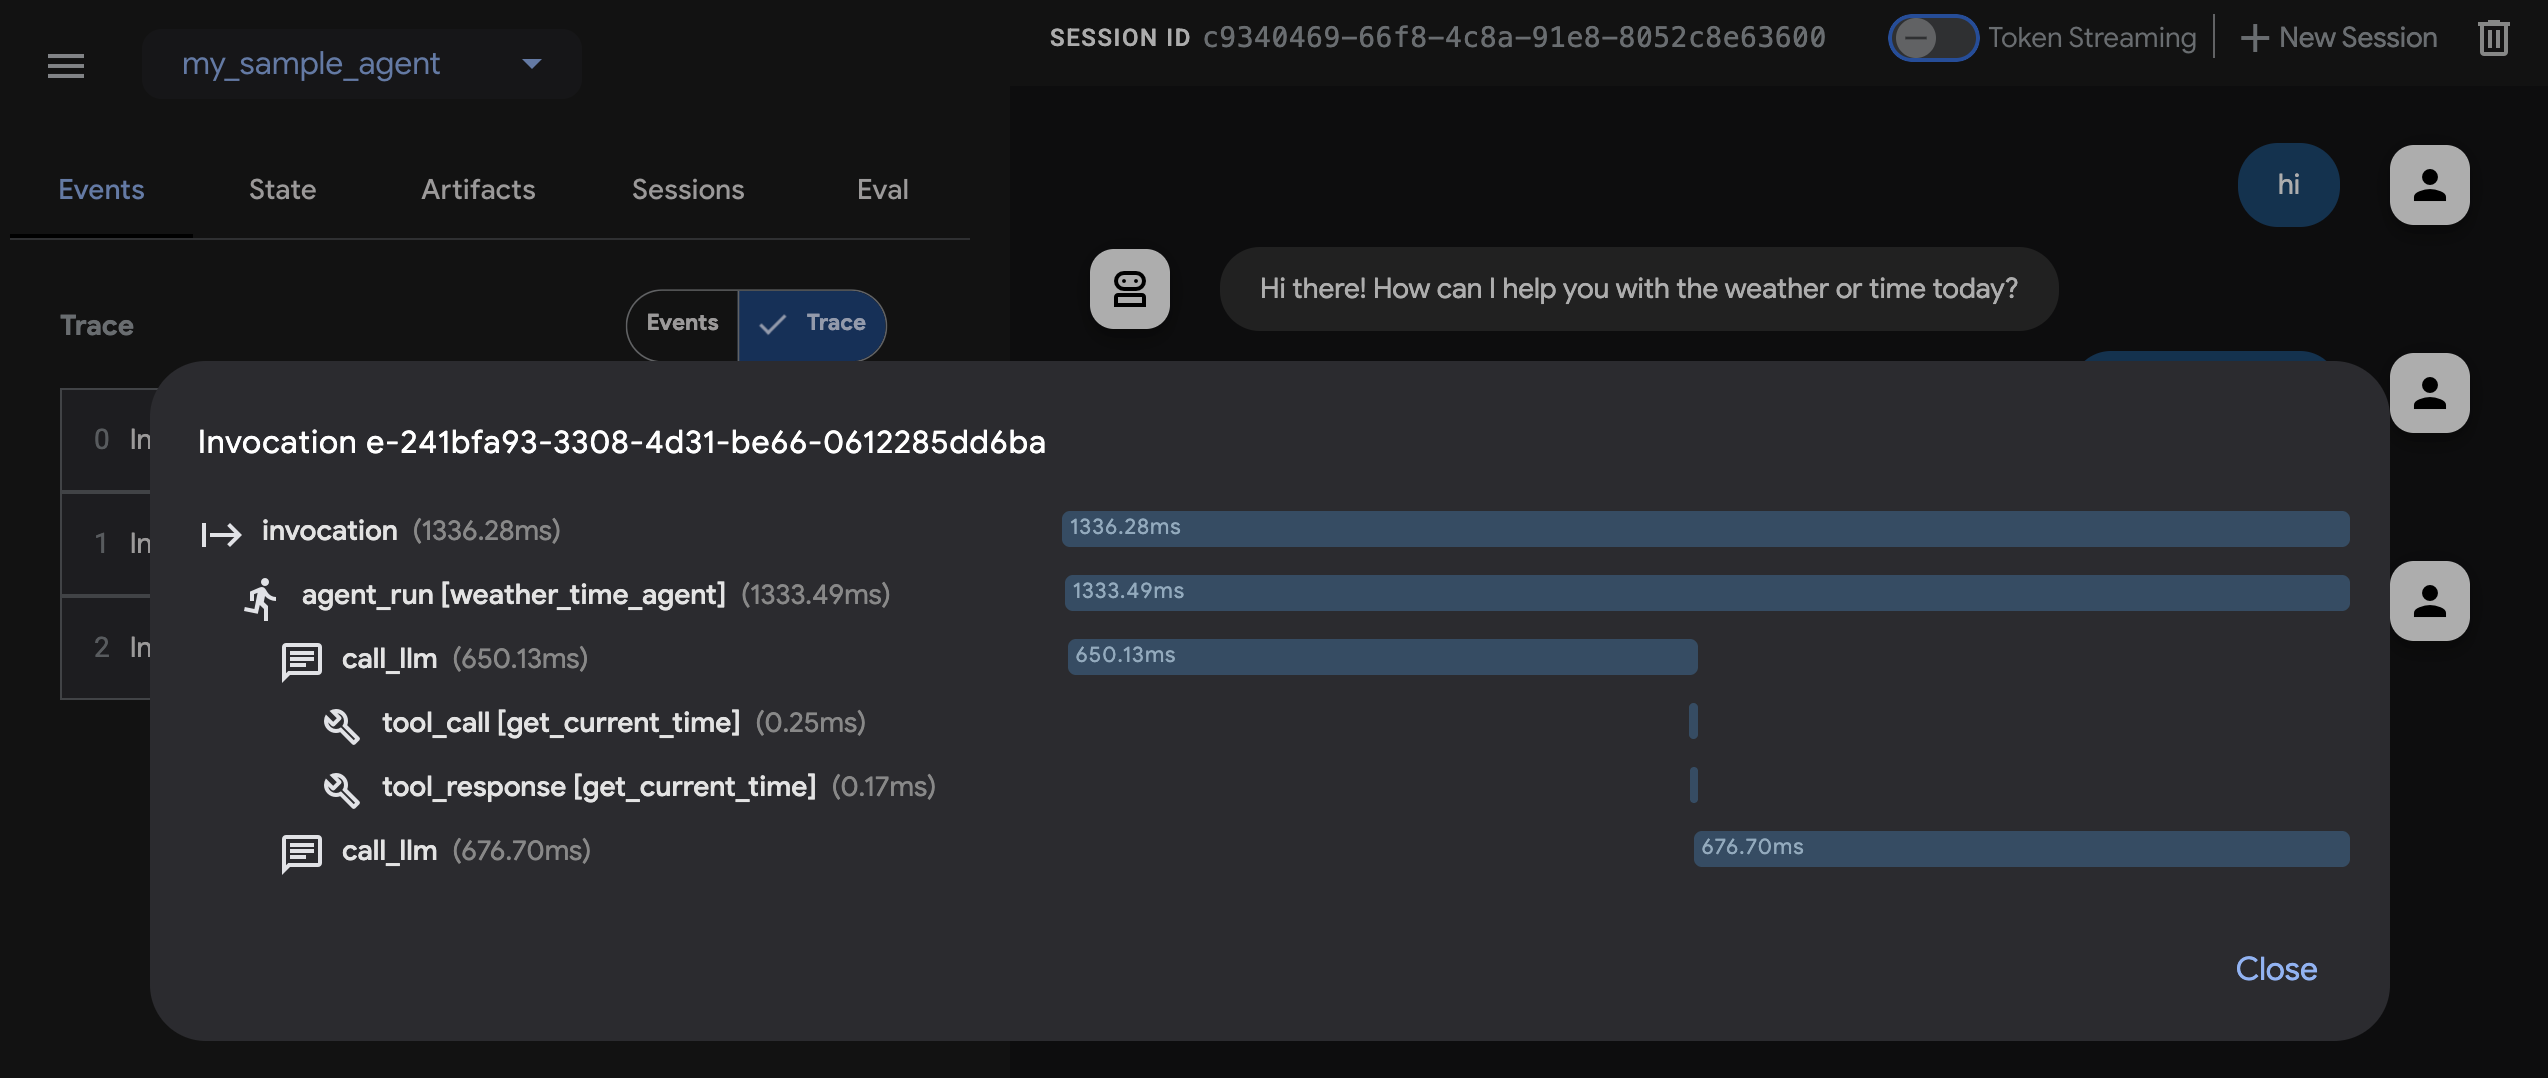
bash# Run with web UI to see traces adk web my_agent # Click on any conversation to see the trace view
The trace view shows:
- Agent execution timeline
- LLM calls with input/output
- Tool calls with arguments and results
- Sub-agent delegations
- Token usage per call
2. Google Cloud Trace
pythonfrom google.adk.plugins import CloudTracePlugin runner = Runner( agent=root_agent, app_name="my_app", session_service=session_service, plugins=[CloudTracePlugin(project_id="my-gcp-project")], )
3. AgentOps
pythonimport agentops # Initialize AgentOps agentops.init(api_key="your-agentops-key") # ADK automatically sends traces to AgentOps runner = Runner( agent=root_agent, app_name="my_app", session_service=session_service, )
4. Custom Monitoring via Plugins
pythonimport time import logging logger = logging.getLogger("adk_monitor") class MonitoringPlugin: def __init__(self): self.total_tokens = 0 self.total_tool_calls = 0 self.total_errors = 0 def before_agent(self, ctx, *args): ctx.state["temp:start_time"] = time.time() logger.info(f"Agent {ctx.agent_name} started") def after_agent(self, ctx, *args): duration = time.time() - ctx.state.get("temp:start_time", 0) logger.info(f"Agent {ctx.agent_name} completed in {duration:.2f}s") def after_model(self, ctx, response, *args): tokens = response.usage_metadata.total_token_count self.total_tokens += tokens logger.info(f"LLM call: {tokens} tokens (total: {self.total_tokens})") def before_tool(self, ctx, tool_call, *args): self.total_tool_calls += 1 logger.info(f"Tool call #{self.total_tool_calls}: {tool_call.function_call.name}") runner = Runner( agent=root_agent, app_name="my_app", session_service=session_service, plugins=[MonitoringPlugin()], )
Key Metrics to Monitor
| Metric | Why |
|---|---|
| Latency | End-to-end response time |
| Token usage | Cost tracking |
| Tool call frequency | Identify bottleneck tools |
| Error rate | Detect failures early |
| Hallucination rate | Quality monitoring |
| Safety violations | Compliance |
| Session length | User engagement |
Learn more at Integrations and Callbacks.